Most team data lives in slides. A weekly deck gets presented once, and then the numbers sit there, locked in a format nobody can search, filter, or click into. In this lesson you take that data out of the slides and turn it into an interactive web page your team can actually use.
An AI tool writes the code. You write the instructions it follows, check that the page works, and send it to your team as one file they open with a double-click.
The example is Northline. Every Friday their sales team presents a six-slide pipeline deck, and by Monday nobody can find it or remembers which deals were at risk. By the end of this lesson, that deck is an interactive webpage where each rep can filter to their own deals and see what needs attention.
What "interactive" means here
A slide shows everyone the same numbers, frozen at Friday's meeting. On the interactive webpage, the finished deliverable you build in this lesson, each person gets the answer to their own question by clicking.
The finished Northline interactive webpage lets Priya:
- click her name and see only her 10 deals
- drag a slider to see whether the team reaches its $1.5M quota if more of the best-case deals close
- click Meridian and see why it's at risk (the champion left) and what to do next (an exec intro before Friday)
Marcus does the same with his deals. The VP of Sales looks at the whole team.
Before and after
The deck
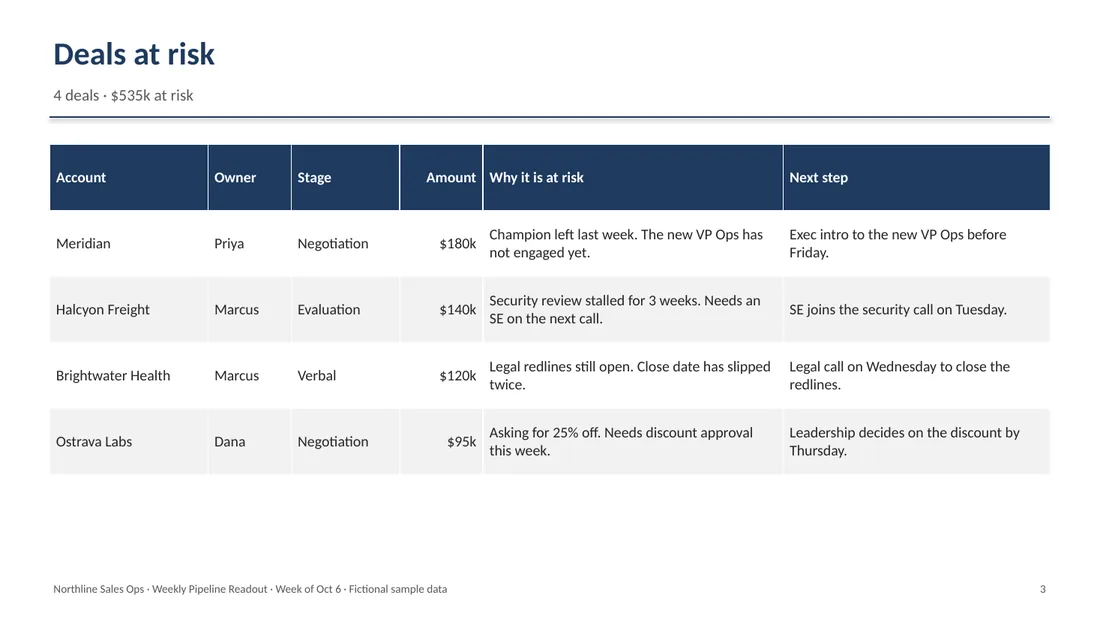
Four at-risk deals in a table, the same for everyone, on slide 3 of 9.
The page
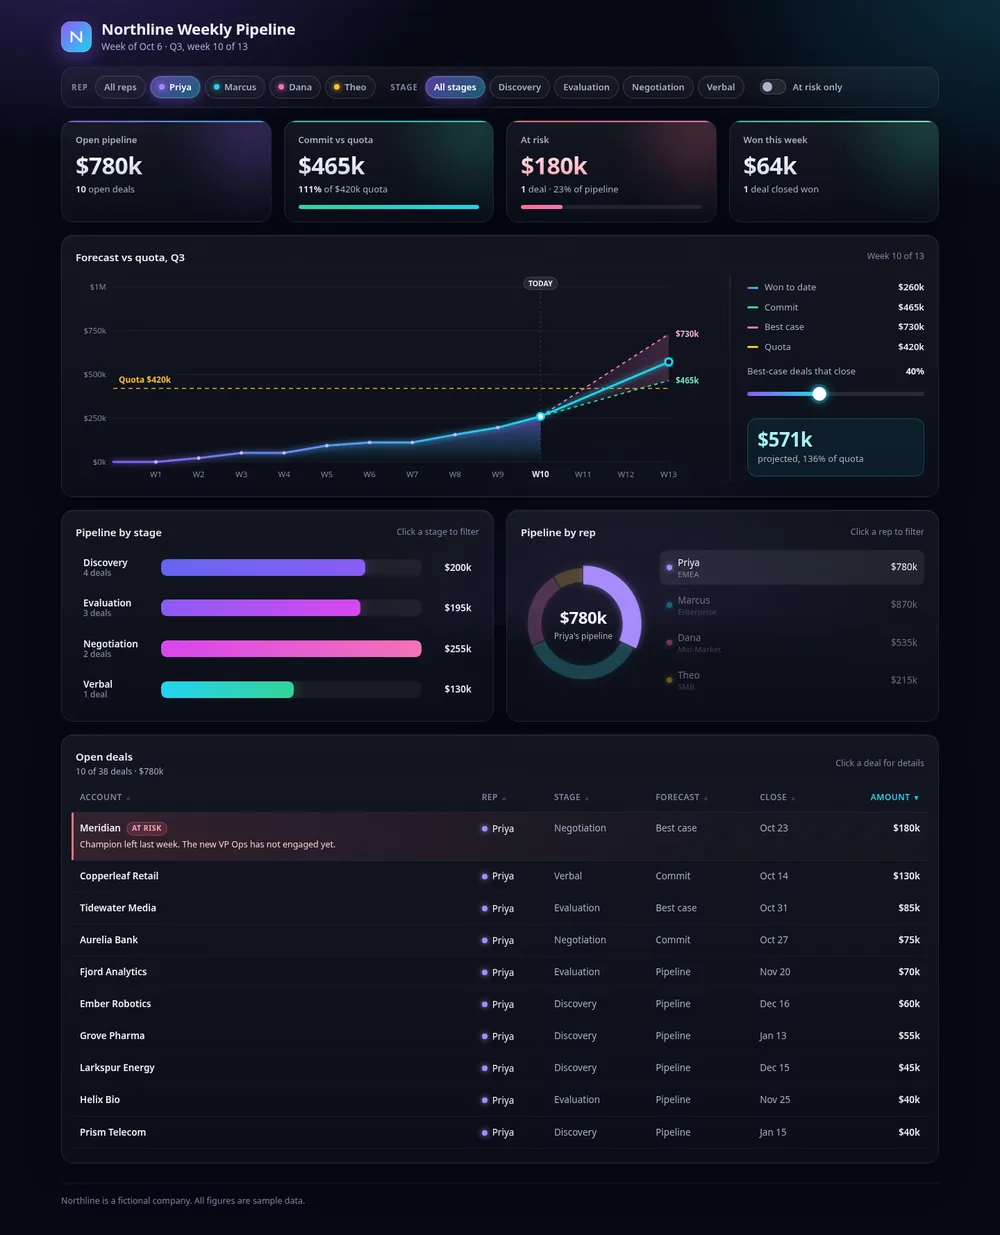
The same deals, highlighted in a table you can filter, sort, and click into.
How you'll get there
An AI tool does the building. You give it two things: the deck as an attachment, and one paragraph saying what to make. Your job is deciding what goes in that paragraph.
This is the exact paragraph that built the example page:
Turn the attached Northline pipeline deck into one interactive web page for Priya, Marcus, and the VP of Sales. Use only the numbers in the deck. Put four headline cards across the top (open pipeline, commit vs quota, at risk, won this week), then a forecast vs quota chart with a slider for how many best-case deals close, pipeline by stage bars, a donut by rep, and a sortable table of every open deal with the at-risk rows highlighted and their risk note shown. Let me filter by rep, stage, and at risk only, and click any deal to see its details. Make it dark and sleek. Give it to me as one file that opens when someone double-clicks it, even offline.
In Step 5 you'll see what each line does, then write your own.
The steps
- Meet the deck (5 min)
- Say who it's for and how you'll know it works (5 min)
- Decide what each slide becomes (5 min)
- Make it interactive (4 min)
- Read the prompt line by line, then write your own (7 min)
- Build it (8 min)
- Send it (2 min)
Seven steps, about 40 minutes in total, with nothing to install.
What you need
- A ChatGPT or Claude account. The free version is fine.
- The Northline deck (download link above), or a weekly deck of your own
What you leave with
- The finished interactive webpage, ready to send to your team
- Your prompt, saved so next week's deck starts from it
- A checklist you can run on any weekly deck